Dog Bites - Correlated to the Phase of the Moon?
This analysis was part of the assessment for CSE454 Learning and Prediction 1, a subject in Computer Science honours at Monash University, Clayton, Australia. I completed this subject with high marks, but sadly didn't complete the project component, and thus only graduated with a Bachelor degree. But, this paper/assignment submission was too much fun not to share.
Download the original PDF version of this short paper
Also, a thank you to Lloyd Allison and Chris Wallace, who ran such an interesting data analysis subject and set a fun assignment.
Dog Bites - Correlated to the Phase of the Moon?
Kymberly Fergusson
Monash University, Clayton, Australia
Computer Science & Software Engineering
© 2002, Kymberly Fergusson, Melbourne, Australia
April 27, 2002
Introduction
There are two conflicting papers concerning the incidence of dog bites occuring on a full moon, Bhattacharjee (1) claims there is evidence to suggest there is a correlation of a higher number of bites and a full moon. This evidence was from a statistical analysis of reports of dog bite vitims treated at a hospital in England. Chapman and Morrel (2) used different data gathered from hospitals around Australia, and found there was no correlation between he full moon and he incidence of dog bites. However, they did not rule out any other correlation.
1 Analysis
The mixture modelling tool Snob was used to see if there were any classes in the original data analysed by Bhattacharjee. If there was a significant increase in dog bites around the full moon, this would have been represented by at least two classes - one containing those bites around the full moon, and the other class/es at other times.
Many attributes were modelled to see if there were other likely hypotheses causing higher incidence of dog bites, such as the day of week, the age of the victim or the gender of the victim.
As this is a circular distribution, the period of the lunar cycle needed to be mapped to radians. The precision of specifying when a dog bite occured actually is 2π/29.53, as the accuracy to which the raw data is specified is only per day.
The recently re-implemented version of Snob, written in C by Chris Wallace in 2001, was chosen over the much earlier version as it was the easiest to compile. It has the added benefits of using factorial models and trees, which often result in savings when describing the parameters. Hoever, when the tests were run on the Fortran version, it was found that the results were usually the same or at least very similar.
1.1 The Simple Model - Phase of moon
Using a single attribute per bite - the phase of the moon - it was found that there was no significant clustering that warranted a second class, especially not on or around a full moon. There was however, a slightly higher incidence of bites found just before a new moon. In Figure 1 you can see the increase in the middle of a cycle (where lunar cycle starts on the full moon).
Figure 1 shows the actual histogram of incidents of dog bites against the phase of the moon (29.53 days, given in radians in the diagram), as well as a plot of the distribution as output by Snob, representing the phase of the moon as a von-mises (circular) distribution. As you can see, these match fairly well, and show that the number of dog bites actually increases slightly around the new moon, opposite to the claim of Bhattacharjee.
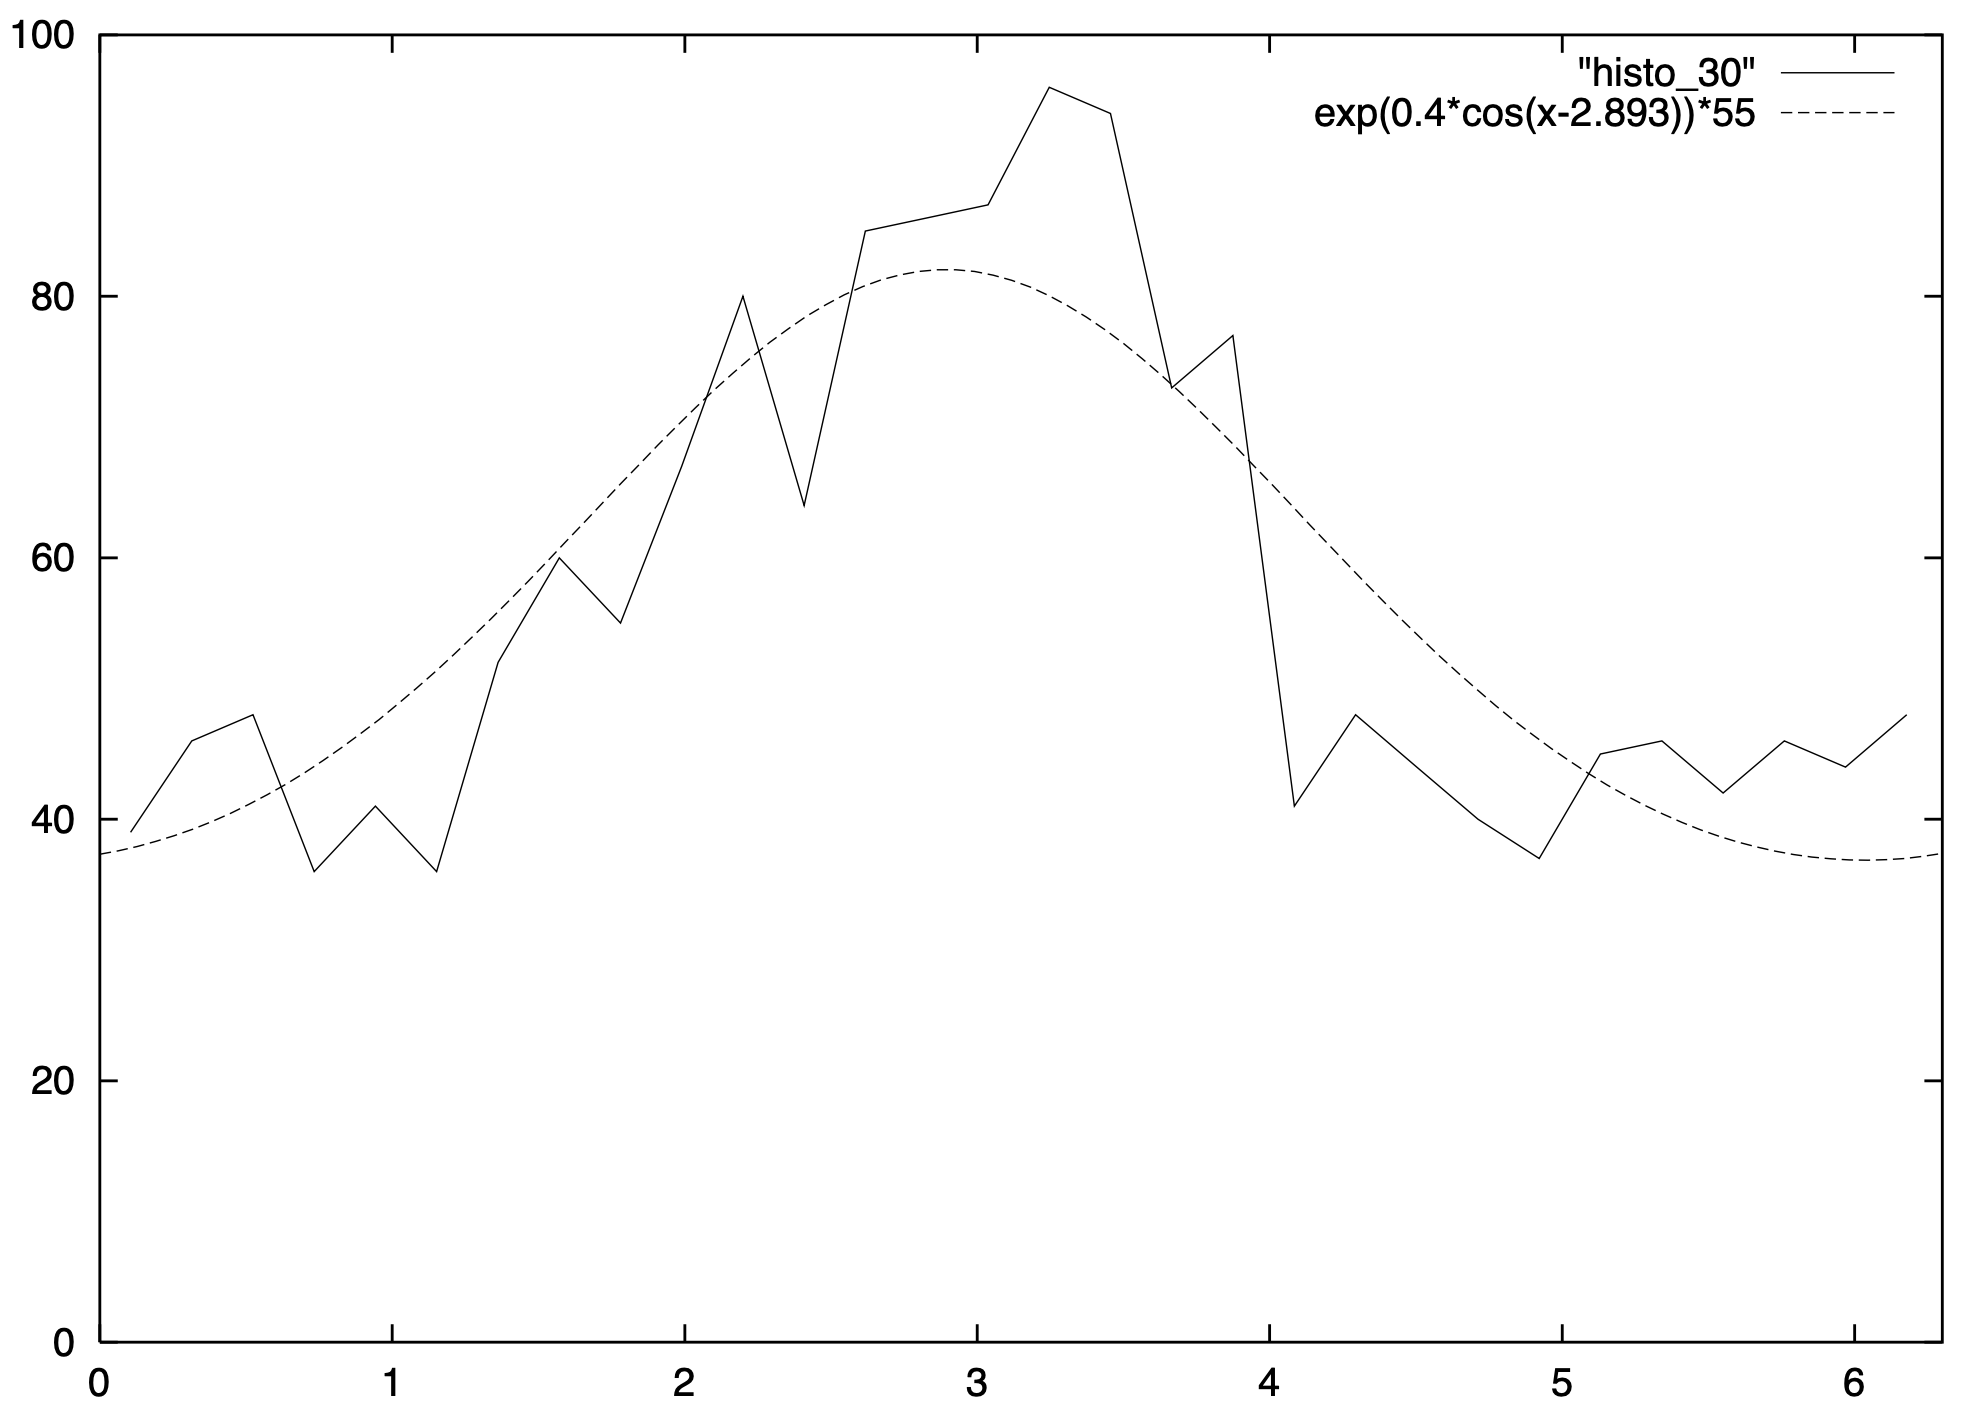
Being a model where only one attribute is considered means the total information cost is low, only 5706.1 nits, with an extremely low cost for describing the distribution parameters, of 8.4.
1.2 An interesting but misleading result
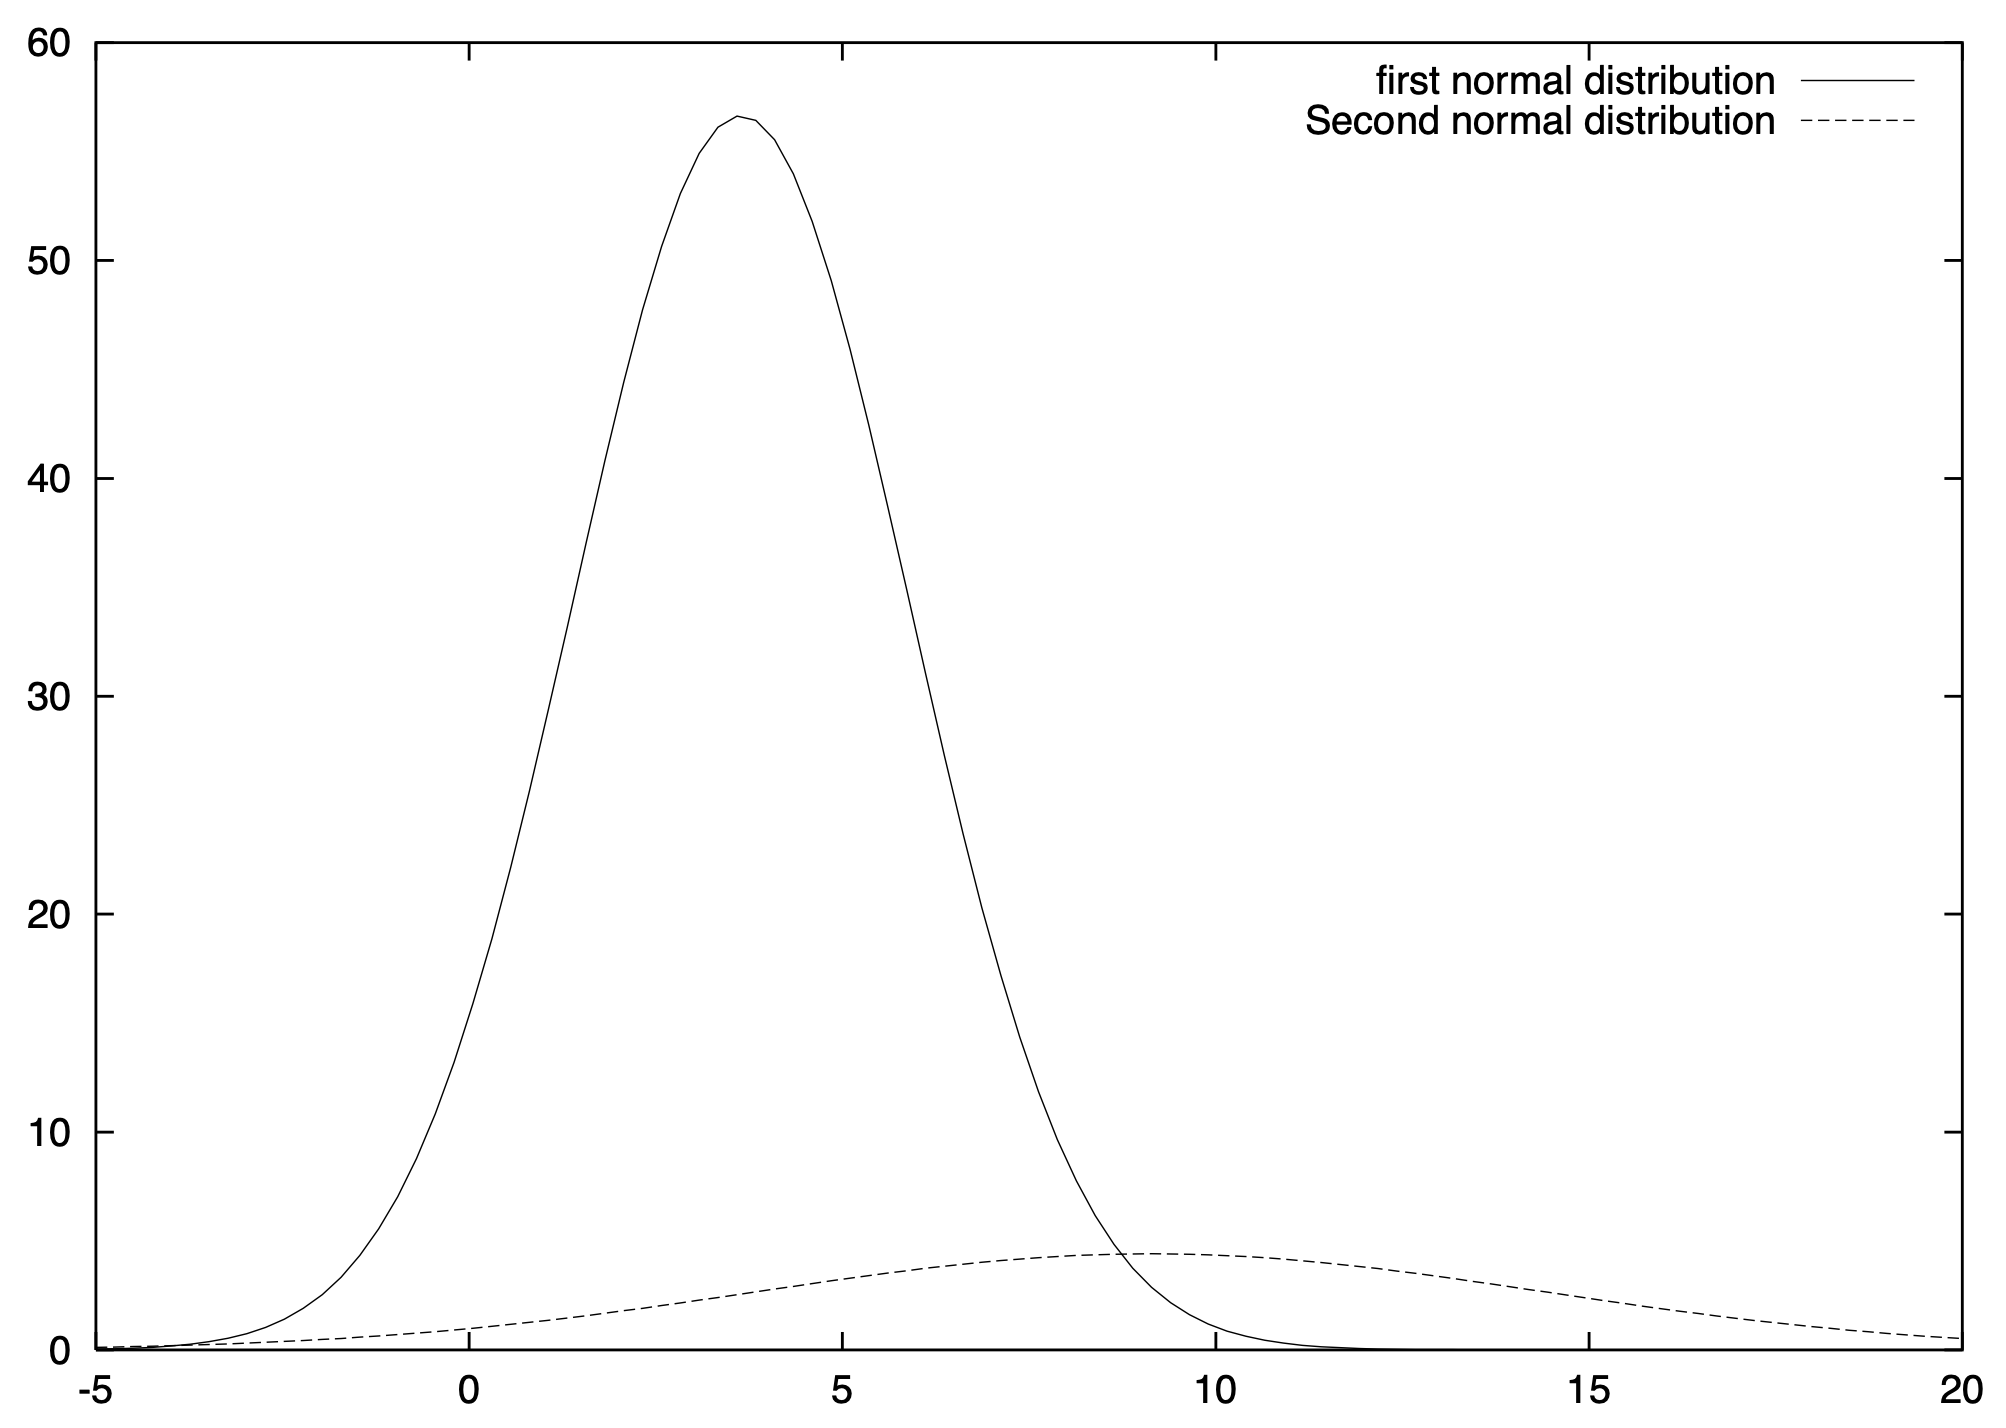
The results for the second test where the attributes were the phase of the moon and the total dog bites for that day, produced an interesting result - Snob outputting two classes with significantly different normal distributions for the total dog bites in each class.
The larger class was centred around the full moon, with a small number of bites, and not much variation (small standard deviation); the smaller class was centred around the new moon with a much higher number of bites and a higher variation.
Figure 2 shows the distribution of bites in the two classes separately, the second class being fairly flat and wide, and the first class narrow with a high peak. When you combine the two models, you can see that the total of dog bites should not be represented using a normal distribution as he shape is distinctly not that of a normal distribution, tending more towards that of a Poisson distribution.
Even though this model gave the lowest overall cost, it should explain that individual dog bites are not represented in the data, only total counts. So the amount of information is naturally less, as it is summarised.
1.3 Other results
The other representations using gender of day of week attributes did not show any significant differences to the simple moon phase representation, apart from their costs getting much higher as they were more complex models.
When using a multi-state distribution for representing age groups as defined in the raw data, a strange result occurred, where the mean of the population moved by one radian to somewhere between new moon and full moon. There was still only one class, with a very wide spread. No reason for this shift could be found. This was the highest information cost for all the models, mainly as describing the distribution parameters cost the most.
2 Conclusions
After analysing various models, with different attributes, it can be seen that there is no obvious concentration of bites around he full moon. If anything, there is a slightly higher incidence of bites reported at the new moon or slightly before it. This analysis seems to refute the claim made by Bhattacharjee et. al., and supports the hypothesis expressed by Chapman and Morrel. It goes further than the second hypothesis and suggests a slight increase in bites around the new moon, but nothing really significant.
There could be a number of factors influencing the data, as it is only for a single year. It might have occurred that new moons more commonly fell on weekends, rather than on any other day of the week for this year. This could bias the results as it is conceivable that people are with their dogs more often on the weekend, rather than when they are working during the week.
Nothing conclusive could be decided from this analysis relating the incidence of dog bites and the phase of the moon.
References and Bibliography
I’d like to thank Bernie Meyer for providing a copy of the C version of Snob, helping with the data conversion and with the maths involved in the various distributions.
-
Chanchal Bhattacharjee, Peter Bradley, Matt Smith, Andrew J. Scally, Bradley J. Wilson, Do animals bite more during a full moon? Retrospective observational analysis. BMJ 2000; V321, ppl 1559-1561 (23 December).
-
Simon Chapman, Stephen Morrell, Barking Mad? Another lunatic hypothesis bites the dust. BMJ 2000; V321, ppl 1561-1563 (23 Dcember)
-
The Sky Above Us from http://www.dartmouth.edu/~astro2/notes/skyabove.pdf that was used for this bibliography entry no longer exists. But the caluclation/formula are available elsewhere. Dave Chapman, The Astronomical Basis of Our Calendar Part 2, Lunar, Solar, and Lunar-Solar Calendars.
-
Data used for the Bhattacharjee study, http://www.csse.monash.edu.au/~lloyd/tilde/csc4/csc423/dog/Dog.txt